> ## Documentation Index
> Fetch the complete documentation index at: https://docs.tradionlabs.com/llms.txt
> Use this file to discover all available pages before exploring further.
# Earnings Spider
> Get the read a desk analyst would write on a quarterly report — numbers, guidance, tone, and both sides of the argument.
Earnings Spider pulls a quarterly report apart: what the company earned, what it promised next, how management sounded, and what the options market expects next.
Included on **Starter** and every plan above it, with no monthly cap. See the [plan comparison](/reference/plan-comparison).
 ## Two ways in
**No file needed.** Type a symbol, choose a quarter, and Tradion fetches the call transcript itself. The quarter list is annotated with beat or miss where known — *2025Q2 — Beat 6.3%*. With no transcript available, Tradion falls back to earnings press coverage without flagging it, so a thin-reading analysis usually means the transcript wasn't there.
Drop in a **PDF or plain-text transcript**, up to **15MB**. Official transcripts and press releases give the cleanest extraction. Image files are not accepted — a photographed page won't upload.
A rolling three-month earnings calendar sits alongside; clicking a company loads it into the ticker field.
## The spider signal
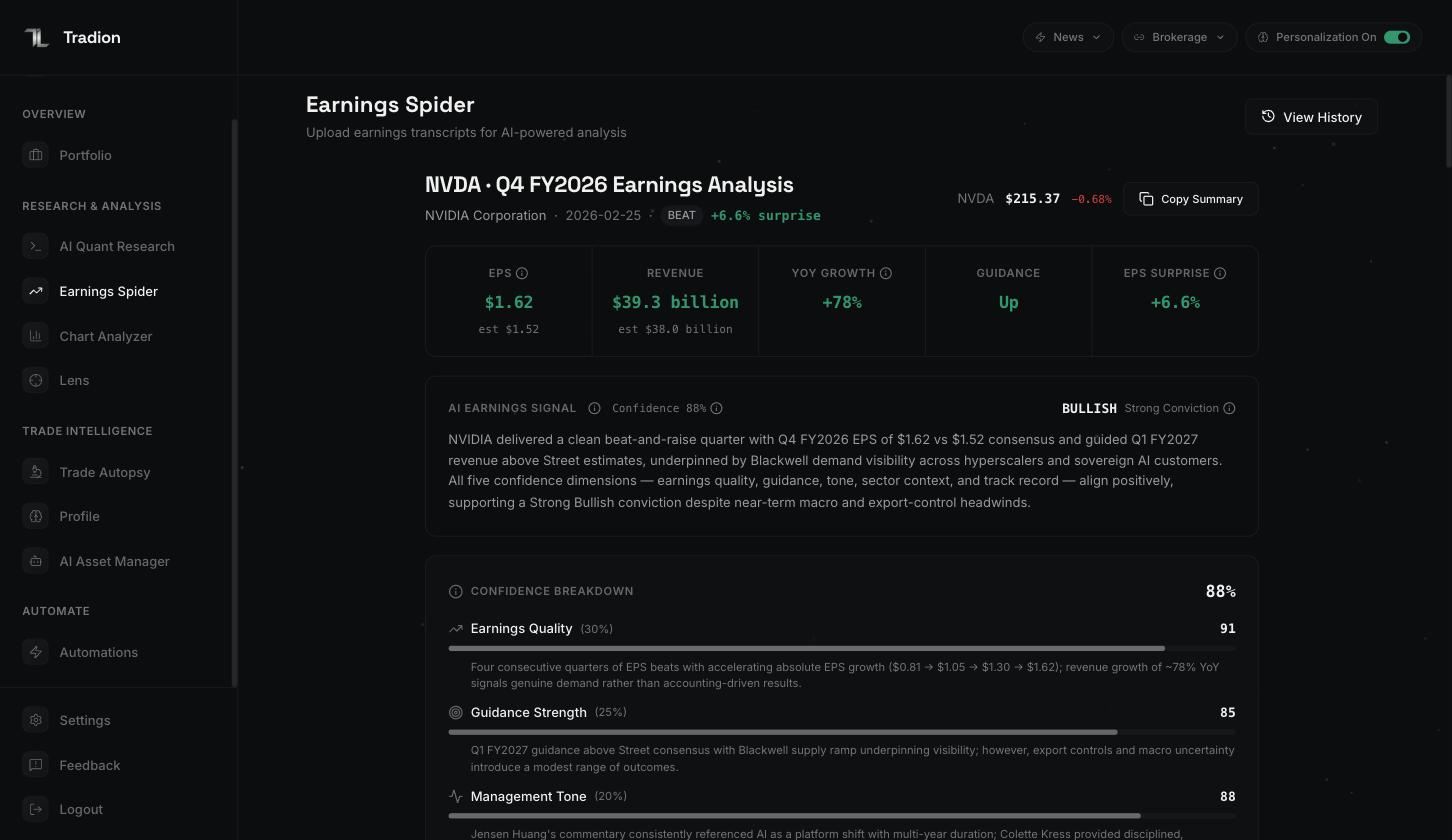
The result opens with a direction — **BULLISH**, **BEARISH**, or **NEUTRAL** — a **conviction** of Strong, Moderate, or Weak, a confidence percentage, and a paragraph of reasoning. Conviction is how firmly it holds that direction; confidence is how well the evidence supports it.
Confidence is a weighted average of five scored factors, each with a one-line justification:
| Factor | Weight | What it scores |
| ----------------- | ------ | ------------------------------------------- |
| Earnings quality | 30% | Size and consistency of the beat or miss |
| Guidance strength | 25% | Clarity and strength of the forward outlook |
| Management tone | 20% | How confident the executives sounded |
| Sector context | 15% | How this compares with the industry |
| Track record | 10% | The company's history against estimates |
[Reading a verdict](/concepts/reading-a-verdict) explains why the five factors matter more than the headline number.
## Key metrics, and what beat and miss mean
A strip across the top shows **EPS**, revenue, year-over-year growth, guidance direction, and the size of the EPS surprise.
**EPS** is earnings per share — total profit divided by the number of shares, which is why Wall Street quotes it: companies of different sizes compare directly.
A **consensus estimate** is the average of what professional analysts covering the stock predicted. **Beat** means the reported figure came in above that average; **miss** means below. Neither says the business is good or bad — it says the business surprised the people paid to predict it.
**YoY** (year-over-year) compares this quarter with the same quarter a year ago rather than last quarter, stripping out seasonal patterns.
### In plain English
A company can beat on EPS and fall anyway. Beating an estimate that was quietly cut twice is not the same as beating a stretch estimate, and the market knows the difference. The beat is the start of the question, not the answer.
## Guidance, and why it moves the stock more
**Guidance** is the company's own forecast for the coming quarter or year — revenue, margins, expenses. Tradion shows each item beside the previous guidance and the analyst consensus.
Guidance moves stocks harder than the reported quarter does, because that quarter is history. A beat paired with guidance below consensus is the classic way a stock falls on good news.
## Management tone
Two panels read how the results were delivered rather than what they were. **Tone divergence** scores the CEO and the CFO separately and flags a gap between them — the chief executive selling the story while the finance chief hedges is worth knowing. **Hedge words** counts uncertainty language ("challenging environment", "transitioning"), rates it low, medium, or high, quotes examples, and says whether it rose or fell since the last call.
Alongside those: a sentiment score with the phrases behind it, red flags, and quotes tagged by speaker and by whether each leans bullish or bearish.
## Bull versus bear, segments, and peers
Tradion writes both cases: a one-line thesis, two or three catalysts or risks, and a conviction rating each. The side you disagree with is the one worth reading.
A **segment** is a part of the business reported separately — a cloud division, a hardware line, a region. The segment table gives revenue and year-over-year growth for each, which is where a flat headline turns out to be one part surging while another sinks. **Peer comparison** puts competitors' EPS against estimate for the same quarter side by side, with how each stock reacted.
## The options implied move
An **implied move** is how far the options market expects the share price to travel, either direction, around the earnings date. It comes from what traders pay for options: a live price on uncertainty, not a published forecast.
The panel leads with that percentage and the price range it implies. Underneath:
* **Straddle cost** — the combined price of one call and one put at the strike nearest the current price. Buying both bets on movement without picking a direction, so its cost *is* the expected move. This panel is the only place straddle numbers appear.
* **At-the-money call and put** — strike, price, and **implied volatility**: how much movement the option's price implies traders expect. Higher means pricier options.
* **IV skew** — whether calls or puts are the more expensive, labelled upside bias or downside fear.
* **Open interest** and volume — how many contracts are outstanding, and how many changed hands today. Both split into calls and puts, with the put/call ratio read as positioning.
A banner warns when the earnings-period options have already expired and you're seeing the nearest active expiration. That snapshot describes today's uncertainty, not the uncertainty around the earnings event.
## Risk factors and the rest
**Risk factors** lists each risk with a severity of High, Medium, or Low and what would offset it. Then an earnings history strip — beat rate and surprise on the last eight quarters — insider buying and selling, macro context, and a watch list for next quarter. **Copy Summary** puts the report on your clipboard.
## Analysis history
Every analysis saves automatically under the company and quarter. History lists them newest first; click to reopen the exact report, or delete it with a confirmation step.
A reopened report carries a live price badge that keeps refreshing. That price is today's, not the price on the earnings date — the report is frozen, the badge is not.
Earnings Spider describes a report. It does not know your positions or your timeline, and none of it is a recommendation to trade.
What direction, conviction, and confidence each claim.
Plain-English definitions for terms used across Tradion.
## Two ways in
**No file needed.** Type a symbol, choose a quarter, and Tradion fetches the call transcript itself. The quarter list is annotated with beat or miss where known — *2025Q2 — Beat 6.3%*. With no transcript available, Tradion falls back to earnings press coverage without flagging it, so a thin-reading analysis usually means the transcript wasn't there.
Drop in a **PDF or plain-text transcript**, up to **15MB**. Official transcripts and press releases give the cleanest extraction. Image files are not accepted — a photographed page won't upload.
A rolling three-month earnings calendar sits alongside; clicking a company loads it into the ticker field.
## The spider signal
The result opens with a direction — **BULLISH**, **BEARISH**, or **NEUTRAL** — a **conviction** of Strong, Moderate, or Weak, a confidence percentage, and a paragraph of reasoning. Conviction is how firmly it holds that direction; confidence is how well the evidence supports it.
Confidence is a weighted average of five scored factors, each with a one-line justification:
| Factor | Weight | What it scores |
| ----------------- | ------ | ------------------------------------------- |
| Earnings quality | 30% | Size and consistency of the beat or miss |
| Guidance strength | 25% | Clarity and strength of the forward outlook |
| Management tone | 20% | How confident the executives sounded |
| Sector context | 15% | How this compares with the industry |
| Track record | 10% | The company's history against estimates |
[Reading a verdict](/concepts/reading-a-verdict) explains why the five factors matter more than the headline number.
## Key metrics, and what beat and miss mean
A strip across the top shows **EPS**, revenue, year-over-year growth, guidance direction, and the size of the EPS surprise.
**EPS** is earnings per share — total profit divided by the number of shares, which is why Wall Street quotes it: companies of different sizes compare directly.
A **consensus estimate** is the average of what professional analysts covering the stock predicted. **Beat** means the reported figure came in above that average; **miss** means below. Neither says the business is good or bad — it says the business surprised the people paid to predict it.
**YoY** (year-over-year) compares this quarter with the same quarter a year ago rather than last quarter, stripping out seasonal patterns.
### In plain English
A company can beat on EPS and fall anyway. Beating an estimate that was quietly cut twice is not the same as beating a stretch estimate, and the market knows the difference. The beat is the start of the question, not the answer.
## Guidance, and why it moves the stock more
**Guidance** is the company's own forecast for the coming quarter or year — revenue, margins, expenses. Tradion shows each item beside the previous guidance and the analyst consensus.
Guidance moves stocks harder than the reported quarter does, because that quarter is history. A beat paired with guidance below consensus is the classic way a stock falls on good news.
## Management tone
Two panels read how the results were delivered rather than what they were. **Tone divergence** scores the CEO and the CFO separately and flags a gap between them — the chief executive selling the story while the finance chief hedges is worth knowing. **Hedge words** counts uncertainty language ("challenging environment", "transitioning"), rates it low, medium, or high, quotes examples, and says whether it rose or fell since the last call.
Alongside those: a sentiment score with the phrases behind it, red flags, and quotes tagged by speaker and by whether each leans bullish or bearish.
## Bull versus bear, segments, and peers
Tradion writes both cases: a one-line thesis, two or three catalysts or risks, and a conviction rating each. The side you disagree with is the one worth reading.
A **segment** is a part of the business reported separately — a cloud division, a hardware line, a region. The segment table gives revenue and year-over-year growth for each, which is where a flat headline turns out to be one part surging while another sinks. **Peer comparison** puts competitors' EPS against estimate for the same quarter side by side, with how each stock reacted.
## The options implied move
An **implied move** is how far the options market expects the share price to travel, either direction, around the earnings date. It comes from what traders pay for options: a live price on uncertainty, not a published forecast.
The panel leads with that percentage and the price range it implies. Underneath:
* **Straddle cost** — the combined price of one call and one put at the strike nearest the current price. Buying both bets on movement without picking a direction, so its cost *is* the expected move. This panel is the only place straddle numbers appear.
* **At-the-money call and put** — strike, price, and **implied volatility**: how much movement the option's price implies traders expect. Higher means pricier options.
* **IV skew** — whether calls or puts are the more expensive, labelled upside bias or downside fear.
* **Open interest** and volume — how many contracts are outstanding, and how many changed hands today. Both split into calls and puts, with the put/call ratio read as positioning.
A banner warns when the earnings-period options have already expired and you're seeing the nearest active expiration. That snapshot describes today's uncertainty, not the uncertainty around the earnings event.
## Risk factors and the rest
**Risk factors** lists each risk with a severity of High, Medium, or Low and what would offset it. Then an earnings history strip — beat rate and surprise on the last eight quarters — insider buying and selling, macro context, and a watch list for next quarter. **Copy Summary** puts the report on your clipboard.
## Analysis history
Every analysis saves automatically under the company and quarter. History lists them newest first; click to reopen the exact report, or delete it with a confirmation step.
A reopened report carries a live price badge that keeps refreshing. That price is today's, not the price on the earnings date — the report is frozen, the badge is not.
Earnings Spider describes a report. It does not know your positions or your timeline, and none of it is a recommendation to trade.
What direction, conviction, and confidence each claim.
Plain-English definitions for terms used across Tradion.