> ## Documentation Index
> Fetch the complete documentation index at: https://docs.tradionlabs.com/llms.txt
> Use this file to discover all available pages before exploring further.
# The live analyst
> A comment on every candle as it closes, from 4:00 AM to 8:00 PM ET, counted in minutes only while it runs.
The live analyst watches the chart in a [Tradion Lens](/research/lens) session with you. Turn on the **Live analyst** switch in the chart toolbar. From then on it writes a comment each time a candle closes on your timeframe (the period each candle covers, from 1 minute to 1 day), and it also speaks up between closes when something happens:
* price breaks one of the day's key levels, the dashed lines on the chart such as yesterday's high and close (or a break is withdrawn);
* a volume spike, meaning a minute that trades at least 3 times its usual volume for that time of day;
* a trading halt, or trading resuming;
* news on the ticker;
* a candle that the market data provider, Alpaca, corrects after the fact.
If it falls behind by more than three candles, it writes one comment covering the whole gap rather than one per candle.
Pick how it writes with the style buttons next to the switch:
| Style | What you get |
| - | - |
| **Beginner** (default) | Two to four short sentences, explaining terms the first time they come up |
| **Experienced** | One or two concise sentences |
The live analyst describes what the chart is doing. It never tells you to buy or sell and never gives price targets. For targets and a trade setup, take a [snapshot](/research/lens#snapshots).
## The AI stream
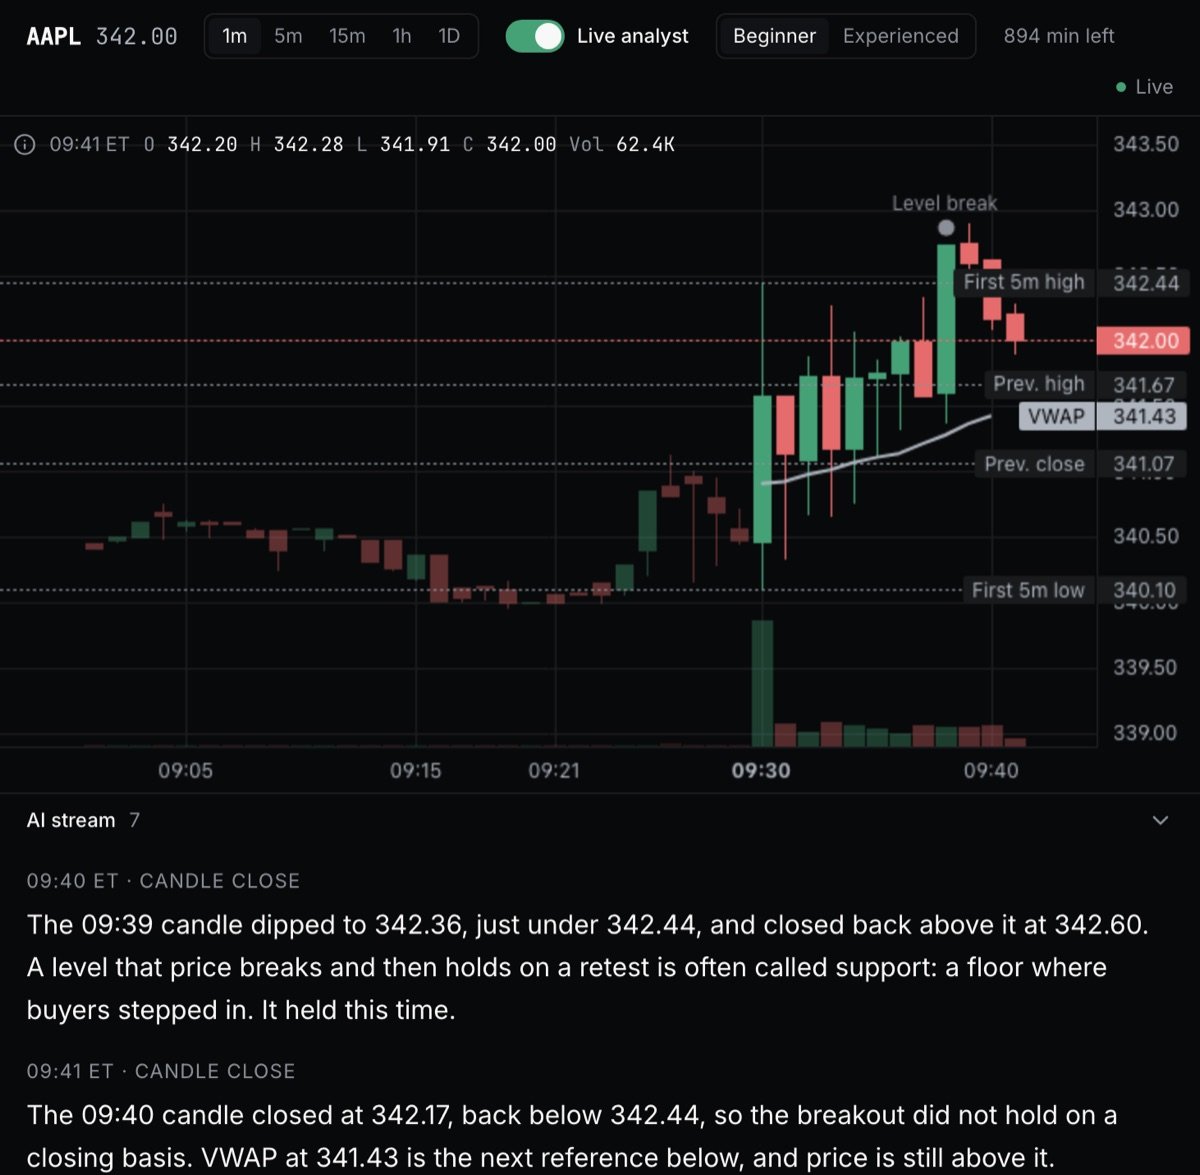 The comments appear in the **AI stream** under the chart. Click a comment and the chart marks the candle it is about, scrolling to it if it's out of view. Comments are kept for **30 days**; **Load earlier comments** reaches back through them.
The stream also posts short notices when something gets in the way, for example: *Market data is down, so the analyst is waiting. It will cover what happened once data is back.*
## When it runs
The live analyst runs from **4:00 AM to 8:00 PM ET on trading days**, which covers pre-market, the regular session and after hours. On early-close days the window ends earlier (5:00 PM ET when the market closes at 1:00 PM). Outside the window the switch won't turn on, but the chart, chat and snapshots work any time.
When the window ends, the last candle gets its comment within about two minutes, and then the analyst pauses with **Paused: the market session is over**.
## One live analyst at a time
You have one live analyst, and it runs in one session in one browser tab. Open another session or tab and the toolbar says **Live analyst is running in another session or tab**, with a **Bring it here** link that moves it. Change the timeframe and the analyst follows the chart.
## How live time is counted
Live time is counted in whole minutes. The first minute is charged when the analyst starts, and each later minute as it begins. Stopping partway through a minute doesn't give that minute back.
The clock only runs while **all** of these are true:
* the switch is on and the analyst isn't paused;
* the tab is visible on your screen;
* market data is flowing;
* it is inside the 4:00 AM to 8:00 PM ET window.
Next to the switch, the toolbar shows what is happening:
| You see | What it means | Clock |
| - | - | - |
| **{n} min left** | Running. Includes any hours you bought. | Running |
| **Waiting for market data** | The market data feed is down or catching up. This is not a pause. | Stopped |
| **Analyst busy, catching up** | The AI model is busy and the analyst is retrying. It covers what it missed once it gets through. | Stopped |
| **Paused: tab hidden** | The tab has been hidden for 30 seconds. Coming back resumes it. | Stopped |
| **Paused: no activity for 10 minutes** | No mouse, click, key or scroll in the tab for 10 minutes. Any of those resumes it. | Stopped |
| **Paused: reconnecting** | Your browser lost its connection to Tradion. | Stopped |
| **Paused: the market session is over** | The 4:00 AM to 8:00 PM ET window has ended. | Stopped |
The clock stops the moment the tab is hidden; the pause label follows 30 seconds later. After **15 minutes paused**, the live analyst ends, and you turn it on again when you want it.
Monthly minutes are used first, then any hours you bought. Monthly minutes reset to your plan's amount on your billing date and don't roll over.
## When your minutes run out
The analyst pauses with **Paused: no live minutes left** and an upgrade prompt opens. From there you can:
* **Add 5 hours for \$10.** Bought hours never expire, are used after your plan's monthly minutes, and stay on your account through renewals, plan changes and cancellation. They're for paying subscribers, so not during the free trial. You can also buy them any time from **Settings → Monthly Usage**.
* **Upgrade** to Pro for 40 hours a month.
* **Wait** for your monthly minutes to reset.
## In plain English
Think of it as a commentator, not an advisor: it says what happened on the chart a moment ago and why it might matter, and leaves the decision to you. You pay for its time only while it can actually watch, so a hidden tab, ten idle minutes or a data outage doesn't use up your hours.
Sessions, the chart, the chat, and snapshots.
Live minutes, snapshots, and when they reset.
Waiting for market data, pauses, and the analyst in another tab.
15 hours on Starter, 40 on Pro, and extra hours.
This documentation is built and hosted on [Mintlify](https://mintlify.com), a developer documentation platform.
The comments appear in the **AI stream** under the chart. Click a comment and the chart marks the candle it is about, scrolling to it if it's out of view. Comments are kept for **30 days**; **Load earlier comments** reaches back through them.
The stream also posts short notices when something gets in the way, for example: *Market data is down, so the analyst is waiting. It will cover what happened once data is back.*
## When it runs
The live analyst runs from **4:00 AM to 8:00 PM ET on trading days**, which covers pre-market, the regular session and after hours. On early-close days the window ends earlier (5:00 PM ET when the market closes at 1:00 PM). Outside the window the switch won't turn on, but the chart, chat and snapshots work any time.
When the window ends, the last candle gets its comment within about two minutes, and then the analyst pauses with **Paused: the market session is over**.
## One live analyst at a time
You have one live analyst, and it runs in one session in one browser tab. Open another session or tab and the toolbar says **Live analyst is running in another session or tab**, with a **Bring it here** link that moves it. Change the timeframe and the analyst follows the chart.
## How live time is counted
Live time is counted in whole minutes. The first minute is charged when the analyst starts, and each later minute as it begins. Stopping partway through a minute doesn't give that minute back.
The clock only runs while **all** of these are true:
* the switch is on and the analyst isn't paused;
* the tab is visible on your screen;
* market data is flowing;
* it is inside the 4:00 AM to 8:00 PM ET window.
Next to the switch, the toolbar shows what is happening:
| You see | What it means | Clock |
| - | - | - |
| **{n} min left** | Running. Includes any hours you bought. | Running |
| **Waiting for market data** | The market data feed is down or catching up. This is not a pause. | Stopped |
| **Analyst busy, catching up** | The AI model is busy and the analyst is retrying. It covers what it missed once it gets through. | Stopped |
| **Paused: tab hidden** | The tab has been hidden for 30 seconds. Coming back resumes it. | Stopped |
| **Paused: no activity for 10 minutes** | No mouse, click, key or scroll in the tab for 10 minutes. Any of those resumes it. | Stopped |
| **Paused: reconnecting** | Your browser lost its connection to Tradion. | Stopped |
| **Paused: the market session is over** | The 4:00 AM to 8:00 PM ET window has ended. | Stopped |
The clock stops the moment the tab is hidden; the pause label follows 30 seconds later. After **15 minutes paused**, the live analyst ends, and you turn it on again when you want it.
Monthly minutes are used first, then any hours you bought. Monthly minutes reset to your plan's amount on your billing date and don't roll over.
## When your minutes run out
The analyst pauses with **Paused: no live minutes left** and an upgrade prompt opens. From there you can:
* **Add 5 hours for \$10.** Bought hours never expire, are used after your plan's monthly minutes, and stay on your account through renewals, plan changes and cancellation. They're for paying subscribers, so not during the free trial. You can also buy them any time from **Settings → Monthly Usage**.
* **Upgrade** to Pro for 40 hours a month.
* **Wait** for your monthly minutes to reset.
## In plain English
Think of it as a commentator, not an advisor: it says what happened on the chart a moment ago and why it might matter, and leaves the decision to you. You pay for its time only while it can actually watch, so a hidden tab, ten idle minutes or a data outage doesn't use up your hours.
Sessions, the chart, the chat, and snapshots.
Live minutes, snapshots, and when they reset.
Waiting for market data, pauses, and the analyst in another tab.
15 hours on Starter, 40 on Pro, and extra hours.
This documentation is built and hosted on [Mintlify](https://mintlify.com), a developer documentation platform.