
Home
The screen you land on every time you sign in. A launchpad, not a dashboard: nothing here is analysis to act on; everything is a way back into work you started.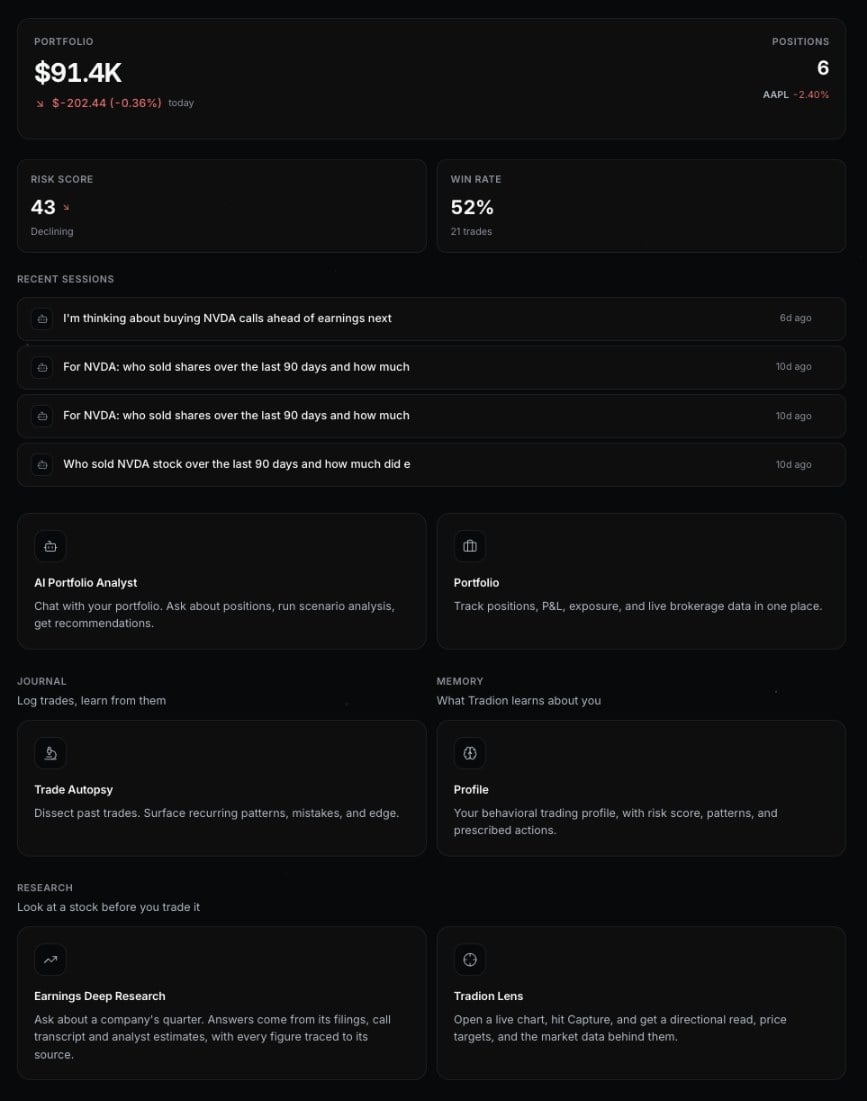
Home, top to bottom: the header, your numbers, recent sessions, and the launcher.
They stay empty until you have logged trades, which is expected on day one and not a fault.
Recent sessions. Your AI Portfolio Analyst conversations, newest first. Clicking one takes you back into the Analyst, so last week’s question is a starting point, not a retype.
The launcher. A card for four of the tools, each with a one-line description, and under them a Research row for the rest. You never need to remember which group a tool sits in.
→ The Tradion Loop
AI Portfolio Analyst
A chat window that can see your real positions. Because it reads live holdings rather than guessing, you can ask concrete things (how concentrated you are in one sector, what a 20% fall in one name would do to the portfolio) and the numbers reconcile with your broker. Sessions are saved; answers come with charts. → AI Portfolio AnalystMy Trading
Portfolio
Everything you hold: an equity curve (a line chart of the account’s value over time) with 1W to All-time ranges, day and total profit and loss, sector allocation with a diversification score, a sortable holdings table with 10-session mini charts, and your biggest movers. It fills in once you connect a brokerage, a read-only link, so Tradion sees positions but places no orders. → Portfolio overview · Connecting a brokerageTrade Autopsy
Where a closed trade gets taken apart. Log it (typed out in plain English, or imported from your broker) then run an autopsy. You get a root-cause breakdown, a 0–100 scorecard across entry quality, exit discipline, and risk management, and a counterfactual: the same trade replayed with one thing changed. Repeat findings become named patterns, and patterns become playbook rules that check you before the next trade. → Trade Autopsy · Logging a tradeProfile
Your trading health check, assembled from everything else: a risk score, recurring mistakes ranked by severity and frequency, win rate by time of day, a year-long calendar of wins and losses, your goals, and your playbook rules. After two autopsies it unlocks a psychological profile, trader archetype, cognitive biases (predictable thinking errors, like holding losers longer than winners) with evidence from your own trades, and how you behave under stress. → ProfileResearch
Earnings Deep Research
A chat that answers questions about a company’s quarter. Ask “Did AMD beat expectations last quarter?” and Tradion reads the company’s SEC filings, its earnings call and the analyst estimates, then writes back with every figure tied to its source. Under the answer sit the company’s financials, a management tone read, and a notebook for saving a thesis you can check when results arrive. → Earnings Deep ResearchTradion Lens
Opens a full-screen live chart of a US stock or ETF. Each session is one ticker, with its own chat and snapshots. A chat sits on the left. Turn on the Live analyst and it comments in the AI stream under the chart each time a candle closes. Take snapshot returns a verdict, a summary, bull/base/bear price targets, and key support and resistance levels (prices where buying or selling may step in). → Tradion Lens · The live analyst · Reading a verdictSettings
Pinned at the bottom of the sidebar: display name, subscription and billing, connected brokerages, account deletion. During a free trial a countdown badge appears above it. Under it sit Feedback, which attaches a note to the screen you were on, and Logout. → Settings · Managing your subscriptionThe status bar
Three controls follow you across most screens. The AI Portfolio Analyst and Earnings Deep Research run edge to edge, so the bar is hidden there:- The news wire, a live headline ticker you can open for the full feed.
- Brokerage. Each connected broker, its accounts, when it last synced, and a sync button.
- Personalization, whether Tradion Memory feeds your history into AI answers. Off means generic analysis. It applies everywhere, immediately. The same switch is mirrored on your Profile.
Quickstart
Signup to first answer in about ten minutes.
The Tradion Loop
Why these screens are stations on one circle.