
Included on Starter and every plan above it, with no monthly cap. See the plan comparison.
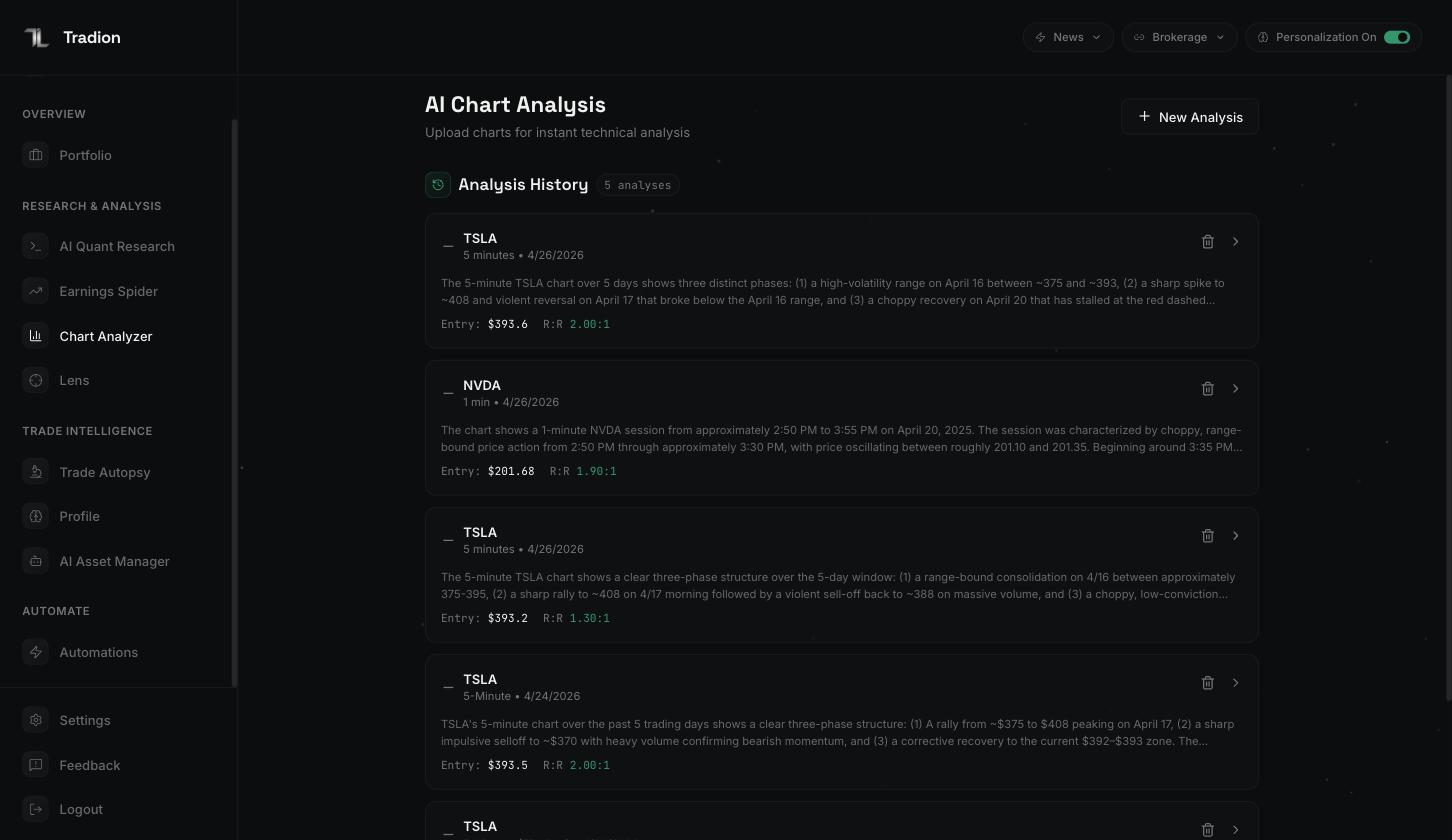
Analysis history — every chart you have run, with its entry level and risk/reward ratio.
Upload a chart
1
Pick a trading mode
Swing (days to weeks), Day Trade (intraday), or Scalp (minutes). Levels scale to the mode: a scalp stop sits much closer to entry than a swing stop.
2
Type a ticker (optional)
The Ticker field anchors the analysis to that symbol, overriding the label printed on the chart. Leave it blank and the model reads the symbol off the image. Fill it in when the symbol is small, abbreviated, or cropped out.
3
Add the image
Click the panel to browse, drag a file onto it, or paste from the clipboard — on macOS,
⌘+Shift+4 then ⌘+V. One image per analysis; candlestick, line, and Heikin Ashi all read fine. Images above 10MB are rejected.4
Click Analyze Chart
Three stages run — scanning, patterns, trade plan. Most charts come back in under a minute.
What makes a chart readable
The model is reading pixels, so anything you can’t make out clearly, it can’t either.
Leave out the clutter. Overlaid indicators, drawing tools, and coloured zones cover the price action the model needs to read. A clean candlestick chart with volume beats a decorated one. For indicator values in the analysis, Lens computes them from live market data instead.
The verdict card
The card leads with BUY, SELL, HOLD, or NO TRADE, then three numbers: Setup Quality out of 10, Risk/Reward, and Confidence as a percentage. Under them sits a headline, a suggested action, the technical breakdown, and up to three key insights.In plain English: the card says HOLD
HOLD means wait. Not “hold your position”, not “we’re unsure” — there is no clear direction on this chart right now. The line under the verdict says the same: Default: No action until conditions change. Elsewhere in Tradion this verdict is written WAIT; the chart card prints HOLD. NO TRADE is a different answer. HOLD is “not yet”. NO TRADE is “this chart cannot support a decision at all”.Trade levels and critical levels
Every verdict carries entry (where the setup makes sense), stop (where you exit for a loss), target (where the move should run out), and risk/reward — the gap to the target divided by the gap to the stop. A Critical Levels panel adds a pivot point (the previous session’s high, low, and close averaged), R1 and S1 (prices above and below where selling and buying have tended to appear, each with a break probability: the estimated chance price pushes through), and ATR — the typical distance the symbol travels in one period. Reading a verdict explains what to do with all of it, including why a stop tighter than the ATR gets taken out by noise. When price hasn’t reached the zone yet, the panel reads Conditional Levels, marked not actionable — waiting for trigger, with Conditional Micro-Plans beside it: what to do if price breaks up, or down.The confidence breakdown
Confidence is a weighted average of five factors, each scored 0–100 with a one-line reason: trend clarity (30%), pattern quality (25%), volume (20%), risk/reward (15%), market context (10%).In plain English
Two charts can both read 68% and mean nothing alike. One might be a textbook pattern nobody is trading; the other, five mediocre scores averaged. Read the five factors, not the headline. A wide spread between them means the evidence disagrees with itself.The rest of the report
The Price Forecast panel draws a cone — a fan of possible prices that widens the further out it reaches — ending in bull, base, and bear points, each with a percentage change, a probability estimate, and a reason you can expand. For listed stocks, Analyst Consensus shows the Wall Street Buy / Hold / Sell split, a price target with the implied upside, and recent upgrades and downgrades by firm. A consensus estimate is the average of what professional analysts covering the stock publish — a crowd opinion, not a measurement. The panel hides itself when no rating data exists, normal for crypto, foreign exchange pairs, and small listings. Below that: a market overview, a table of key invalidation levels (prices that would prove the idea wrong), three trade scenarios with triggers, a game plan covering entries and exits, and a market structure section ending in price receipts — the observations the verdict rests on.Analysis history
Every analysis with a detected ticker saves automatically, chart image included. History is the landing view — click any entry to reopen the full report; Delete removes it permanently. Two things go wrong. A banner reading “Analysis displayed but could not be saved to history” means the result on screen is fine but nothing was stored. And entries created before full-report saving reopen with a notice rather than a report; those need re-running.Chart Analyzer reads the image and nothing else. There is no follow-up question box, no live price check against your levels, and no strategy code to export. To ask questions about a chart in conversation, use Lens, which keeps the analysis in context.
Reading a verdict
Entry, stop, target, break probability, and how confidence misleads.
Lens
Live charts inside Tradion, backed by real market data.