
Included on both plans. Each month Starter gets 15 hours of the live analyst and 50 snapshots, and Pro gets 40 hours and 100 snapshots. The chat is included and not counted against an allowance. See the plan comparison.
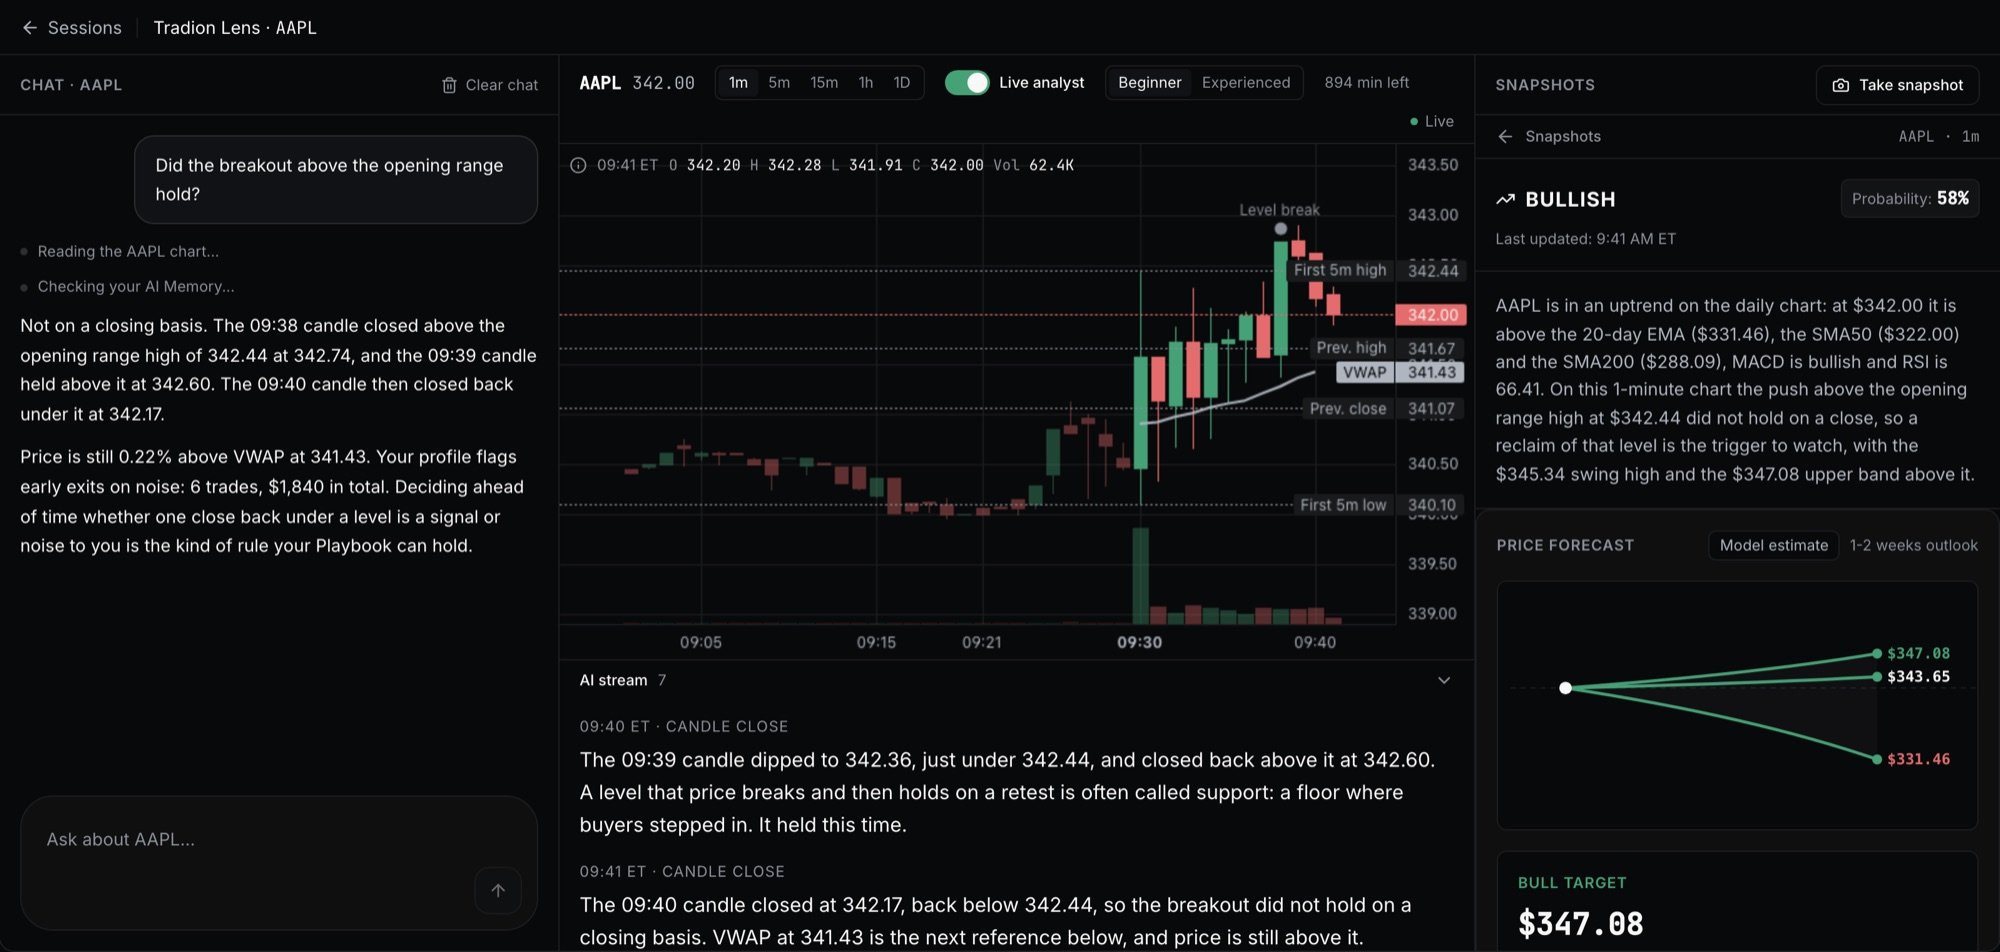
An example AAPL session on a 1-minute chart: a chat question on the left, the live analyst's comments under the chart, and a snapshot open on the right.
Lens is built for a desktop browser. On a phone, Tradion shows a Built for desktop screen instead.
Start a session
A session is one ticker with its own chat, snapshots and AI stream. You can have several on the same ticker.1
Open Tradion Lens and click New Session
Search for a ticker. Only US stocks and ETFs are listed.
2
Pick a timeframe
1m, 5m, 15m, 1h or 1D, meaning one candle per minute, per 5 minutes, and so on up to one per day. The default is 5m. You can change it inside the session; the ticker stays fixed.
3
Click Start Session
The chart opens. The live analyst starts off, so nothing is counted until you turn it on.
The chart
The chart is Tradion’s own and updates live. Prices come from Alpaca’s consolidated feed (SIP, the stream that combines trades from every US exchange), and all times are in US Eastern time (ET).- Candles and volume. Pre-market and after-hours candles are drawn faded.
- VWAP, the volume-weighted average price: the average price paid today, weighted by how much traded at each price. It’s the solid line, drawn for today’s regular session only.
- Key levels, the dashed lines: the previous day’s high, low and close, today’s pre-market high and low, and the high and low of the first 5 and 15 minutes of the session.
- Dots mark the live analyst’s events: a level break, a volume spike, a halt, trading resuming, or news.
- Candle patterns. Hover an older candle and, if it completes one of 25 standard candlestick patterns, the legend names it with its traditional reading.
The live analyst
Turn on the Live analyst switch in the chart toolbar and it writes a short comment each time a candle closes, plus a note when something happens between closes: a key level breaks, volume spikes, trading halts, or news lands. The comments collect in the AI stream under the chart. It runs from 4:00 AM to 8:00 PM ET on trading days and is counted in minutes, only while it’s actually running. The live analyst page covers what it comments on, when it runs, and exactly how live time is counted.In plain English
The live analyst is a running commentary: it tells you, in words, what the chart did a moment ago. A snapshot is a full read you ask for, with a verdict, targets and a trade setup. The chat is for your own questions. Only the live analyst’s minutes and your snapshots count against your plan.The chat
The chat on the left answers questions about the session’s stock, like How is NVDA trading today? or When does NVDA report earnings next? Each answer can use:- the chart itself, and today’s live analyst comments since your last question;
- the snapshot you have open, if any;
- live data: news, the earnings calendar and estimates, earnings call transcripts, SEC filings, options chains, insider trades and economic data;
- with personalization on, your positions, your trade history and your Tradion Memory.
Snapshots
A snapshot is a full written read of the chart at one moment. Click Take snapshot at the top of the right-hand panel. The card shows Analyzing the chart… while it works and opens the report when it’s done. A snapshot saves itself, so it’s kept even if you close the page while it runs. You can take one at a time.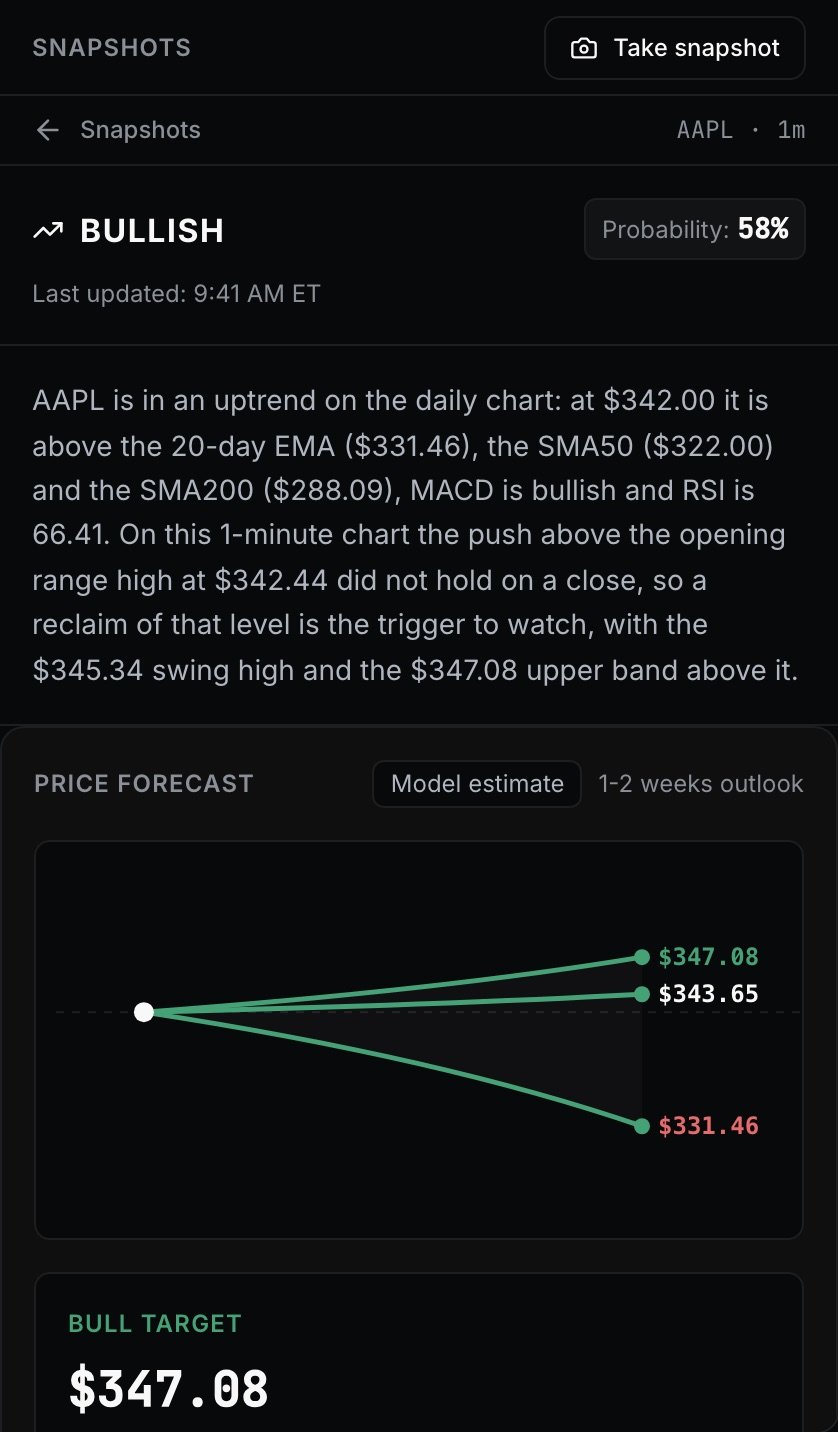
The top of a snapshot report: the verdict and probability, the summary, then the price forecast.
- Verdict: BULLISH, BEARISH or NEUTRAL, with a Probability percentage. Probability is how strong the read is, not the odds of a profit; Reading a verdict explains what it does and doesn’t tell you.
- Summary: the read in one paragraph.
- Price Forecast: a bull, base and bear target, each marked as a model estimate.
- Trade Setup: entry, stop and target, and R:R (risk to reward, how much the target would make for each unit the stop would lose). Shown only when there is a valid setup; a NEUTRAL read has none.
- Critical Levels: a pivot point (the previous period’s high, low and close averaged), R1 Resistance above and S1 Support below, chosen from levels such as the moving averages, Fibonacci levels and Bollinger Bands, each with a model’s estimate of the chance price breaks through it, and ATR (Average True Range), how far the stock typically moves in one period.
- Signals & Anomalies: five observations, covering volume and on-balance volume (a running total that adds volume on up days and subtracts it on down days), the 50- and 200-day moving averages (the average closing price over the last 50 and 200 days), Fibonacci levels (fractions of a past move where a pullback often stalls) and Bollinger Bands (a channel around a moving average showing how stretched price is), how the stock is doing against the S&P 500 (SPY), and, with personalization on, a note about you.
- Upcoming Events: scheduled dates such as earnings, dividends, splits and economic releases.
If something goes wrong
- Retry appears on a snapshot that failed. A failed snapshot gives its count back, and a retry never charges twice.
- Not saved means the analysis finished but couldn’t be stored. Retry saving stores it without a new charge. The analysis is held for a day.
- Deleting a snapshot removes it for good and doesn’t give the count back.
Personalization
With personalization on, the live analyst, the chat and the snapshot’s last signal use what Tradion knows about your trading. The chat also adds to your Tradion Memory: once a thread has been quiet for 10 minutes, it saves up to three short notes from it. Turn personalization off in Settings and Lens works from market data only: the chat can’t see your positions or trades, nothing is learned, and the live analyst starts a fresh thread without your context. Resetting your Memory also starts the live analyst on a fresh thread.What Lens doesn’t do
- US stocks and ETFs only. No crypto, forex or options charts. You can still ask the chat about a stock’s options chain.
- Only Tradion’s chart. Lens doesn’t read your other tabs, a trading platform, or an uploaded image.
- No phones. Lens needs a desktop browser.
Reading a verdict
What the verdict, probability, and levels mean.
The live analyst
What it comments on, when it runs, and how live time is counted.
Usage limits
Live minutes, snapshots, and when they reset.
Data sources
Where the prices, news, and filings come from.