
Earnings Deep Research answers questions about a company’s results. You ask, it reads the company’s quarterly reports (the filings US public companies must send the SEC, the Securities and Exchange Commission), its earnings call and the analyst estimates, then writes back with every figure tied to where it came from.
Included on both plans, with its own monthly allowance: 10 messages on Starter and 25 on Pro. See the plan comparison.
A research thread showing a two-company tone question, then a reported financials panel for one retailer with tabs named Overview, What Changed, Compare and Scenarios, and four headline figures

The start of a thread: your question, then the company's reported financials with a selector for each company you asked about.

Ask a question

1

Open Earnings Deep Research

Pick it from the main sidebar. Your past questions are listed under Your research, newest first.
2

Name the company, then ask

Type a ticker such as NVDA or $NVDA (the short code a company trades under), or pick a suggested question. A question can name up to three companies. Try “Did AMD beat expectations last quarter?” or “Compare cash conversion at MSFT and AMZN.”
3

Watch it work

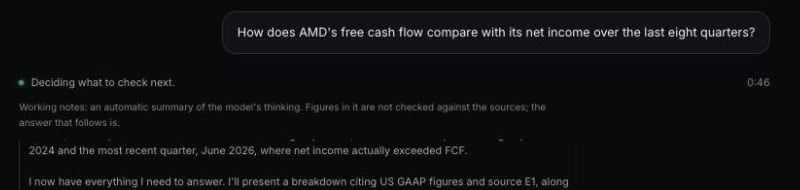
Each source it fetches appears as a row, such as Fetching AMD transcript. While it decides what else to check, a Working notes box shows its reasoning as it goes.
4

Read, then follow up

The answer streams in section by section. Ask a follow-up in the same thread and it keeps the context of the conversation.
Most answers take one to two minutes. A question that names several companies, or whose first draft has to be rewritten, can run considerably longer.

The working notes

A question followed by a progress line reading Deciding what to check next, a label explaining the notes are an automatic summary, and a scrolling box of the summary text

Mid-run: the step it is on, and an automatic summary of its thinking underneath.

The notes are an automatic summary of the AI’s thinking, shown so you are not watching a blank screen. They are not checked. A number in them can be wrong, and they disappear when the answer starts. Trust the answer that follows, which is checked. How the checking works.

The four views

Under every answer sits a financial panel for the company, with a selector when you asked about more than one. Every figure in it comes from the company’s own filings.

Overview

The Overview tab showing revenue, year-over-year revenue growth, operating margin and free cash flow, three short explanations, a chart with revenue as bars and free cash flow as a line, and a line chart of cash conversion, operating margin and stock compensation

Four headline figures for the latest quarter, three one-line reads, and two charts across the last eight quarters.

Year-over-year compares a quarter with the same quarter a year earlier, which strips out seasonal swings. The three reads underneath cover growth, cash conversion (how much of reported profit arrived as cash) and share-based compensation (stock paid to employees, a cost that shows up as dilution rather than cash).

What Changed

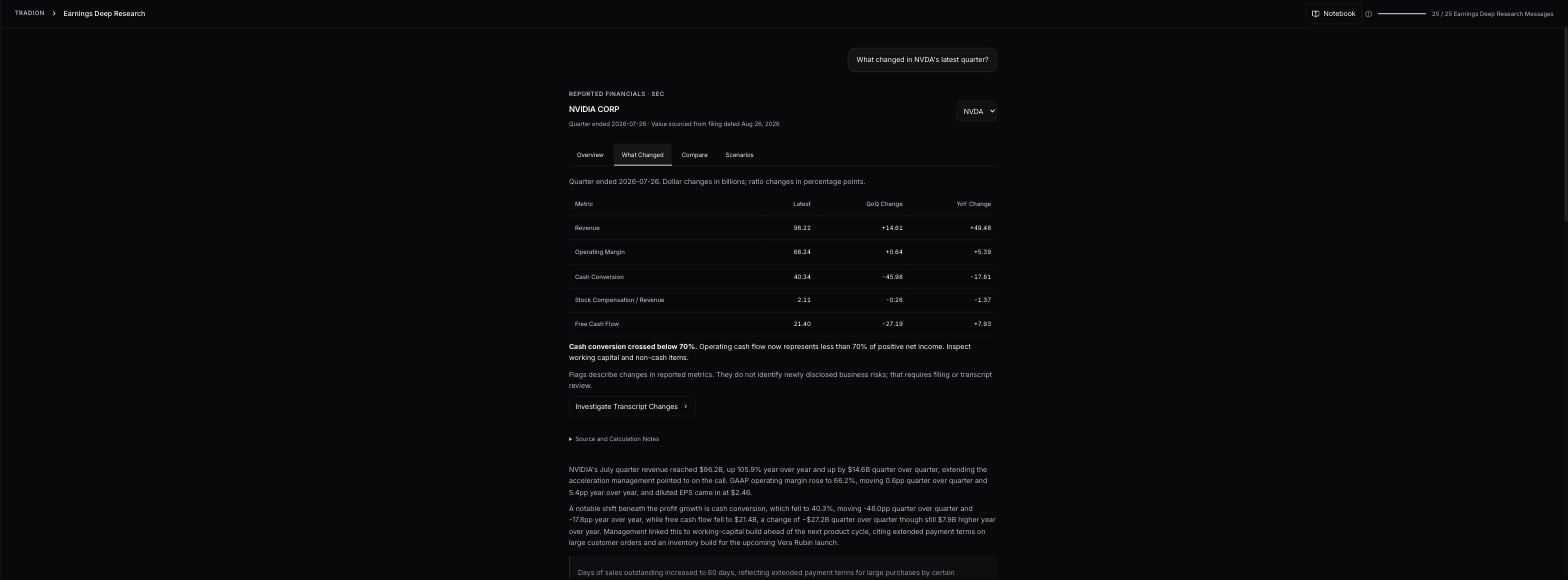
A table of five metrics with columns for the latest value, the change from the previous quarter and the change from the same quarter a year earlier

Each metric's latest value, and how far it moved from the previous quarter and from a year ago.

QoQ (quarter over quarter) is the move from the previous quarter. Dollar changes are in billions and ratio changes are in percentage points, the plain difference between two percentages. A footnote says what the table cannot do: it describes changes in reported figures and does not identify newly disclosed risks. That takes reading the filing or the transcript.

Compare

A table comparing two retailers by period end, revenue, year-over-year growth, operating margin and free cash flow

Companies side by side. Their quarters can end on different dates, so read the period column.

Fiscal calendars differ, so two companies’ latest quarters are not always the same three months. Figures follow GAAP (US Generally Accepted Accounting Principles, the standard rules filings follow).

Scenarios

The Scenarios tab with fields for revenue growth, net margin and target fiscal period end, two computed scenario figures, a box for assumptions and a Save Forecast button

Type a revenue growth and a net margin, and it works out what they would imply. Save it to your notebook.

A scenario is your assumptions turned into arithmetic. Tradion assigns it no probability. Saving one starts a forecast you can check against the reported result, covered in the notebook.

In plain English

The panel is the raw figures, taken from the company’s filings. The answer above it is the AI’s explanation of them. If you want to see where a figure came from, choose View Source under the answer to open the sources behind it, each linking to its filing.

What counts as a message

Every question you send is one message, follow-ups included. The counter in the top bar and Settings → Monthly Usage show what is left. It resets on your billing date, and unused messages do not roll over.
  • A run that fails on Tradion’s side returns your message automatically.
  • Stop ends the run early. The message is still counted.
  • Ask Again, shown after a stop, is a new question and costs a new message. After a failure, Try Again either resumes the run you already paid for or, once the message has been returned, starts a fresh one.
Details: usage limits.

Where it goes wrong

No ticker was found in your question. Type one, such as $NVDA.
Call transcripts usually appear within a few weeks of the call. Until then the answer is built from the filings and estimates, and it says so.
Charts are drawn only from cited figures in a single unit, and only when the comparison is like for like. A request that mixes dollars with percentages, or figures measured on different bases, is dropped and the notice tells you. Ask for one measure at a time.
A very wide question can use up what one message is allowed to read. Start a narrower follow-up, for example one company or one measure.
This describes a company’s reported results and analyst estimates. It does not know your positions or your timeline, and none of it is a recommendation to trade.

Next

Where the numbers come from

The sources, how figures are checked, and what beat and miss mean here.

The notebook

Save a thesis or a forecast and check it when results arrive.

Usage limits

What each counter counts and when it resets.

Plan comparison

What Starter and Pro include.